Picasso
Database Query Optimizer Visualizer
©Indian
Institute of Science,
PLAN TREE WINDOWS
This section describes the various plan-related
windows: Schematic Plan Tree, Compiled Plan Tree,
Plan Difference, and
Foreign Plan Tree that arise from keyboard-mouse
operations on the Picasso diagrams.
1. Schematic Plan Tree window:
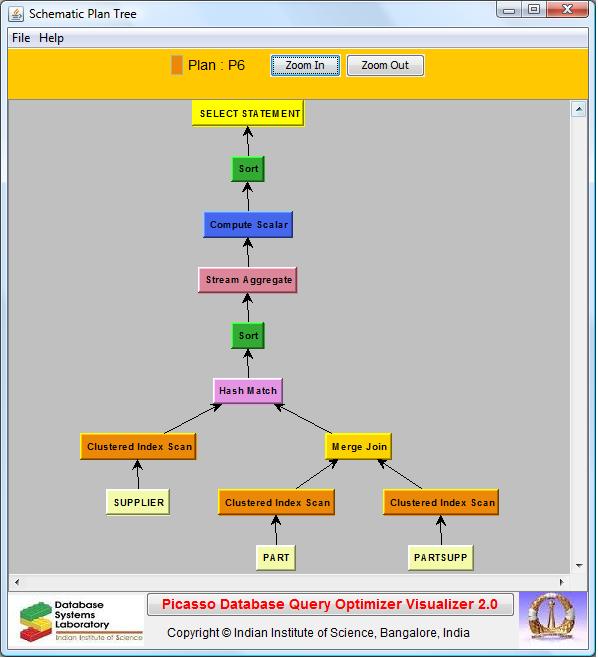
This window appears when any plan region in PlanDiag
or Reduced PlanDiag is right-clicked
and displays the schematic structure of the associated plan tree. The window also appears when any plan in the
legends that are shown in all the compilation diagrams (PlanDiag, Reduced PlanDiag, CompCost,
CompCard) is clicked. The
window has these controls:
Zoom
In button: Click to enlarge the tree.
Zoom
Out button: Click to shrink the tree.
Node
Information: When a node
in the plan tree is selected, this panel shows the name of the node and its
parameter details, if any.
Plan
Tree: This is the pictorial representation of the plan
tree. Each node in this tree represents an execution operation and is
displayed with its name. Further, each node type is assigned a unique
color. Clicking on a node displays its details (including parameter
information, if any) in the space above the tree. If necessary, the nodes
and edges in the tree can be moved around to enhance the display clarity.
Note: The names of the nodes are retained the same
as those used by the respective database engines. That is, similar operators may be named
differently across plan trees corresponding to different database engines (e.g. DB2 uses RETURN and TBSCAN to refer to what Oracle chooses to call SELECT STATEMENT and TABLE
ACCESS, respectively.) Refer
the vendor documentation for the semantics of the various node types.
Menu
bar:
File menu: There are 4 menu items: Save,
Print,
Print Preview and Exit.
Their functions are the same as those in the root client window.
Help
menu:
Usage Guide:
Opens a help page pertaining to Plan Windows.
About Picasso: Displays a dialog containing information on
Picasso including version, home page, etc.
2. Compiled Plan Tree window:

This window appears when the user executes a Shift+right-click on any point within the PlanDiag. This window has the same
controls as the Schematic Plan Tree, with the addition of a Display Type drop-down box - the selection in this box determines what information
is displayed for each node. The default
setting is ‘Both’,
whereby the cost and cardinality at each node is shown. With ‘Cost’ only the cost is shown, while with ‘Card’
only the cardinality is shown, and with ‘None’, the vanilla plan tree is displayed. The
difference between Compiled Plan Tree and Plan Tree is that the compiled plan
tree is with respect to a specific query point, whereas the plan tree is with
respect to a plan region.
3. Plan Difference window:
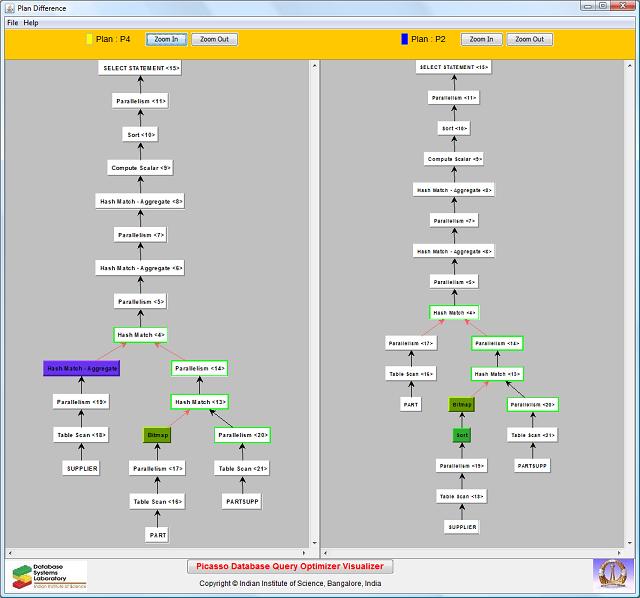
This window appears when the user right-clicks
on a particular plan (either in the diagram for PlanDiag and Reduced PlanDiag, or in the legend for all
the compilation diagrams) and then drags the mouse and drops on a different plan.
It shows side-by-side the schematic plan trees corresponding to these two plans. The
nodes which perform the same function (i.e. same label) with the same inputs in
both the plans are shown completely in white,
signifying their commonality. The differences, on the other hand, are
highlighted through different colors, as given below:
-
Node labels, Node parameters and Node inputs are identical: White nodes with Black input links
-
Node labels are the same: White Fill
-
Node labels are different: Red-bordered nodes filled with the native node color
-
Nodes are unmapped (i.e. no corresponding node in the other tree): Nodes filled with the native node color and Black input links
o
Parameters different: Green-bordered nodes with Black
input links
o
Left
and right inputs swapped: Orange-bordered nodes with Blue input links
o
Left and right inputs different: Orange-bordered nodes
with Red input links
o
Left and right inputs swapped: Blue input links
o
Left and right inputs different: Red input links
The controls in this window are the same as those in
the Schematic Plan Tree window, with an additional item, Color
Code Guide, in the Help menu,
which displays the above color coding.
Note that when plan difference is carried out on a OperatorDiff-based plan diagram, the trees will always include at least one
colored node or link (that is, unlike ParameterDiff-based plan diagrams, it is not
possible to have pure black-and-white trees with only green node borders).
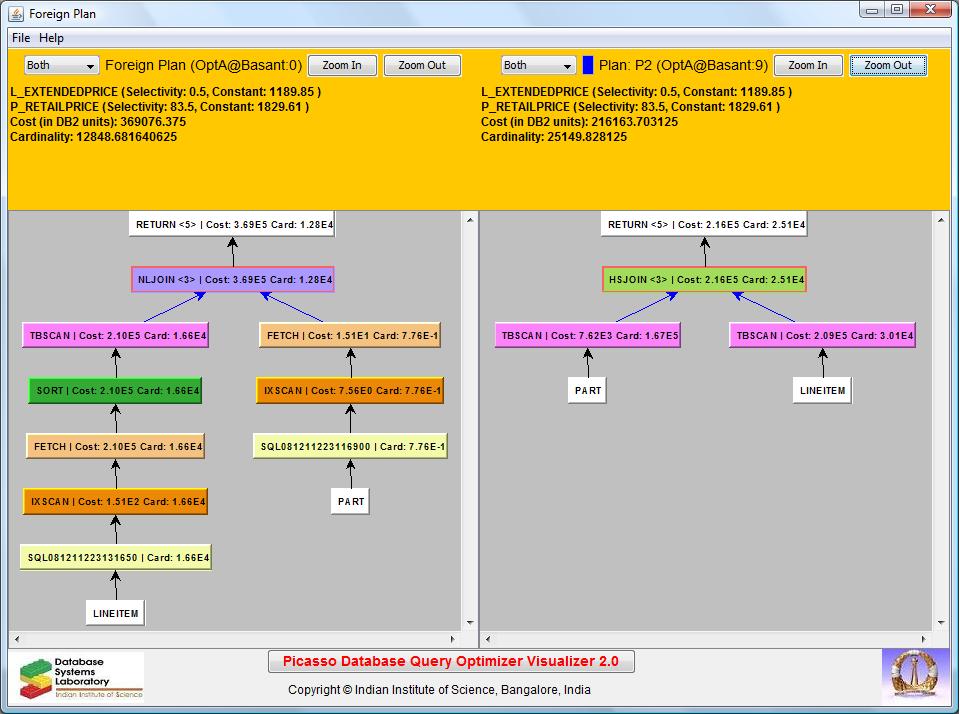
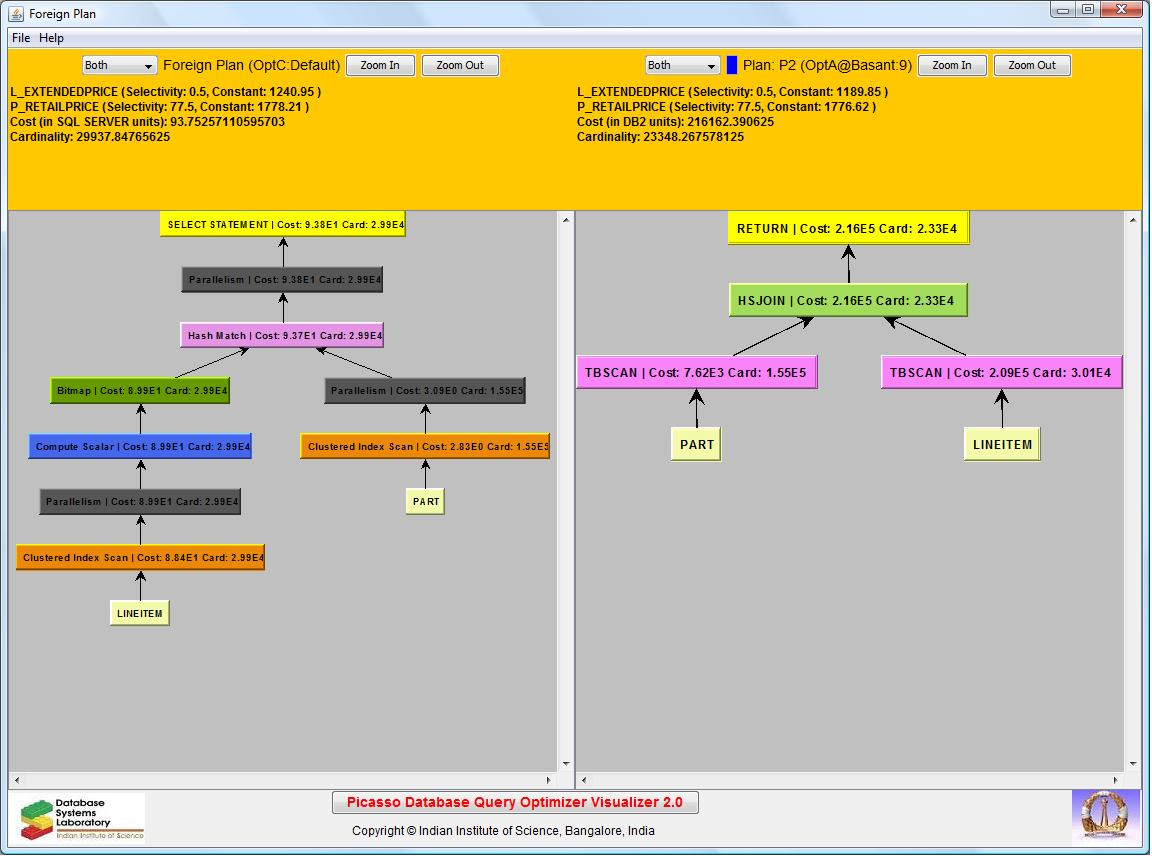
4. Foreign Plan Tree window:
This window appears when the user executes a Ctrl+Alt+right-click
on any point within the PlanDiag
and chooses either a foreign engine, or the same engine at a different
optimization level. The window shows
the compiled versions of both the foreign plan-tree and the local plan-tree
at the selectivity coordinates of the
clicked point. If a common engine is used, then the schematic plan
difference between the two trees is also shown.
The settings panel for this functionality is shown below.
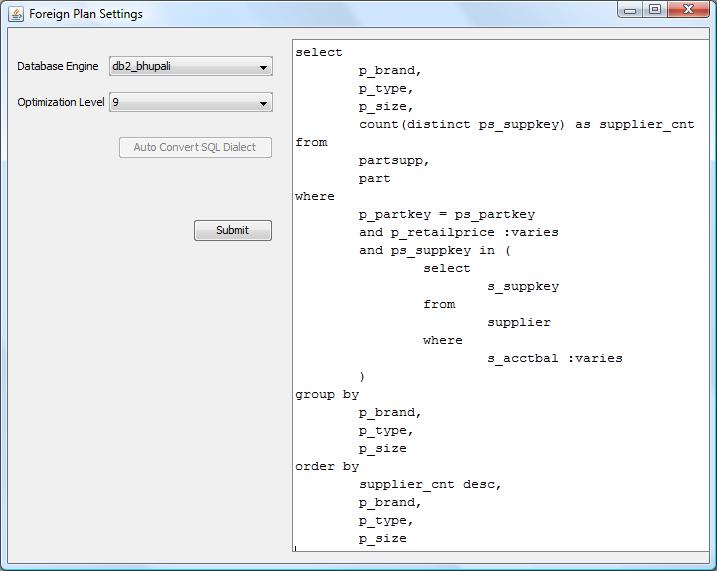
- Example Foreign Plan Tree Diagram for the Different Engines case:
- Example Foreign Plan Tree Diagram for the Same Engine case (note the Plan Difference comparison):