Picasso Database Query Optimizer
Visualizer
©Indian Institute of
Science,
USAGE GUIDE
Overview
The motivation
and conceptual framework underlying the Picasso Database Query Optimizer
Visualizer software are presented in this VLDB 2005 paper
and this set of presentation
slides (Note: The diagram formats and interfaces in these documents are
outdated with respect to the current code but the concepts remain essentially
the same).
The primary user input to Picasso is a query template. A Picasso query template is
an SQL query that additionally features predicates of the form "relation.attribute
:varies" – these
attributes are termed as Picasso Selectivity Predicates (PSP). A sample template (based on Query 14 of the
TPC-H benchmark) is shown below, with the two PSPs highlighted in yellow:
select l_extendedprice
* (1 - l_discount)
from lineitem,
part
where l_partkey
= p_partkey
and l_extendedprice :varies
and p_retailprice :varies
Each template defines an n-dimensional
relational selectivity space, where n is the number of PSP relations. That
is, the selectivity of each of the PSP relations is varied over the range [0-100%], and the objective is to
characterize the optimizer behavior over this selectivity space. In the above
example, which shows a 2-D template, the selectivity space corresponds to the lineitem and part relations.
The query template is converted into a sequence of
queries, each of which represents a different point in the selectivity space,
through one-sided range predicates of the form “relation.attribute ≤
constant” implementing each PSP.
Note that this formulation also ensures the property of query subsumption as we move outwards
from the origin of the selectivity space.
To estimate the constants that would result in the desired selectivities
of the PSP relations, Picasso essentially carries out an “inverse-transform” of
the statistical summaries (as present in the database engine’s metadata)
corresponding to these relations.
To meaningfully cover the full range of selectivities,
a Picasso query template should satisfy the following conditions:
o Each relation can participate in at most one PSP.
o The PSP relations should feature only in join predicates in the query, but not
in any other equality or range predicates.
o The permissible data-types for a PSP column
are integer, float, string and date (and their equivalents).
o For a PSP
column of data-type string, the
permitted characters in the string are A-Z,
a-z and 0-9.
o The PSP attributes must have pre-generated statistical summaries.
o The PSPs should be on dense-domain attributes in high-cardinality
relations.
o The attribute names appearing in the PSPs
must either all be unique or disambiguated by explicitly providing REL_NAME.ATTR_NAME
in the PSP.
Given
a Picasso query template and a choice of database engine, the Picasso tool
automatically generates a variety of diagrams that characterize the behavior of
the engine’s optimizer over this relational selectivity space. The diagrams
include:
1.
Plan Diagram: A
pictorial enumeration of the execution plan choices.
2.
Cost Diagram: A
visualization of the associated estimated plan execution costs.
3.
Cardinality Diagram: A visualization of the associated
estimated query result cardinalities.
4. Reduced Plan Diagram: Shows the extent to which the original plan diagram may be simplified (by replacing some of the plans with their siblings in the plan diagram) without increasing the cost of any individual query by more than a user-specified threshold value.
5.
Schematic Plan-tree Diagram: A
tree visualization of a selected plan in the plan diagram.
6.
Plan-difference Diagram: Highlights the
schematic differences between a selected pair of plans in the plan diagram.
7. Compiled Plan-tree Diagram: A tree visualization of a selected plan at a specific location in the plan diagram, annotated with cost and cardinality information.
8. Foreign Plan-tree Diagram: At
a given location in a plan diagram produced on a database engine, a tree
visualization of the plan produced by another engine (or the same engine at
another optimization level) at this location.
9. Abstract-Plan Diagram: A visualization of the behavior of a selected
plan in the plan diagram, when the optimizer is requested to use this specific
plan throughout the selectivity space. [This feature is operational only on SQL Server and
Sybase ASE.]
Apart
from query compilation-related diagrams, Picasso also produces:
10. Execution Cost Diagram: A visualization of the runtime query response times.
11.
Execution Cardinality Diagram: A
visualization of the runtime query result cardinalities.
There are four basic steps in using Picasso:
1.
Starting a Picasso Server.
2.
Starting the Picasso Client and connecting to the
Picasso Server.
3.
Connecting to a DB engine through the Picasso Server.
4.
Creating (or selecting) a Query Template and
generating (or viewing) the associated Picasso diagrams.
These steps are described in detail in the remainder
of this document.
Steps 1-3: Setup
1.
Start the Picasso server by executing runServer.bat | runServer.sh
in PicassoRun\Windows
| PicassoRun/Unix directory, giving the port number through which
the server will interface with clients as an optional argument (the default
port number is 4444). The server
will start and run in a console window.
2.
Start the Picasso Client by executing runClient.bat | runClient.sh
in PicassoRun\Windows
| PicassoRun/Unix directory. When the client starts, the following
'Welcome' screen appears.

Click on the 'Enter' button in this screen. A
dialog asking for the Picasso Server information is displayed with default
values.
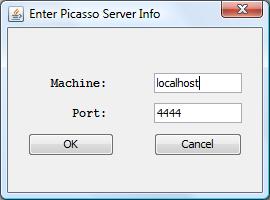
Enter the required information and click OK.
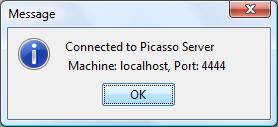
The confirmation message will appear. Click OK.
Then the Picasso Client screen appears, looking like:
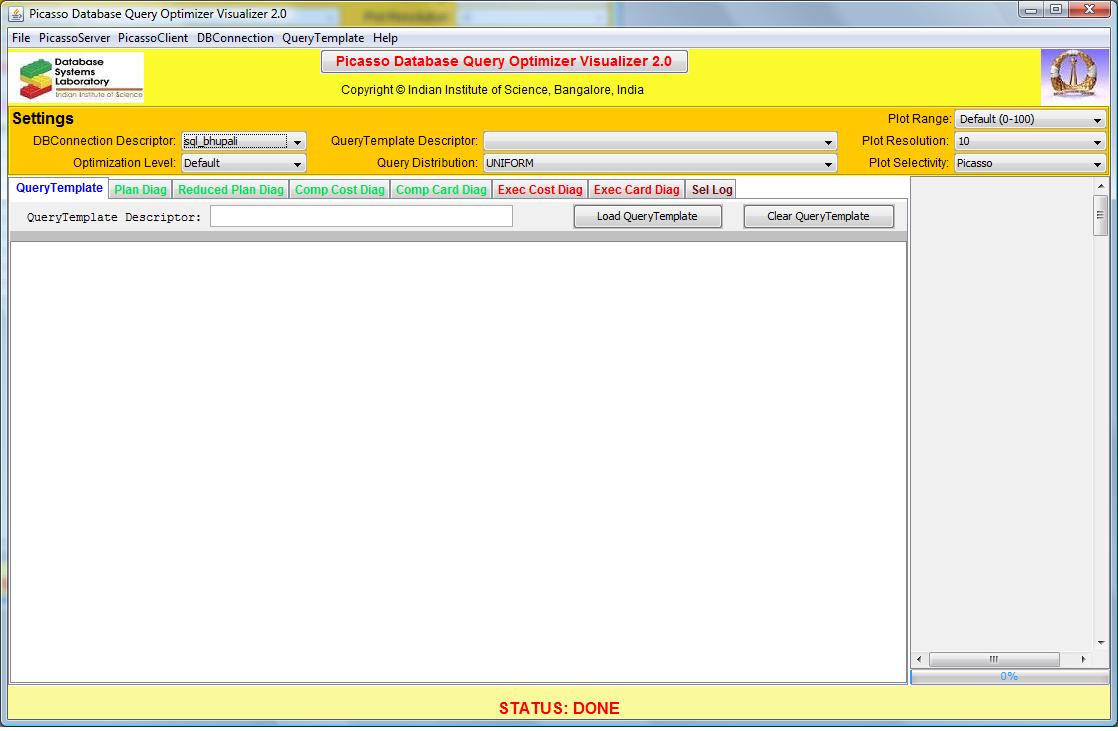
To learn in detail about the controls on the Picasso Client screen, see Client GUI Controls.
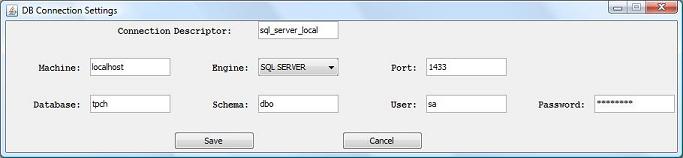
1.
In the DBConnection
menu click New. (Or
you can select one of the existing database instances from the DBConnection Descriptor dropdown list and
from the DBConnection menu
click Edit.) The
following dialog will appear. Enter the
required details and click Save.
Step 4: Generating Picasso Diagrams
2.
In the Settings panel, set the required fields.
![]()
3.
In the diagram panel, go to the QueryTemplate tab. Enter a Picasso
query template by either typing in a query template or clicking on the Load QueryTemplate button and selecting a
file containing a query template. Then enter a suitable name to identify
this template in the QueryTemplate Descriptor
field. (The maximum permitted length of the descriptor is specified by QTNAME_LENGTH in PicassoConstants.java and the
default value is 128).
Note: Representative query templates based on
the TPC-H benchmark are available for all the database engines in the QueryTemplates
directory.
4.
To obtain any of the diagrams (Plan/CompCost/CompCard/ExecCost/ExecCard),
click on the associated tabs. If the diagram had been previously
generated, the picture is retrieved by the server and shown immediately.
Otherwise, a dialog comes up indicating the estimated time to generate and
asking whether the diagram should be generated. Click OK if
you want to generate. A new feature of Picasso 2.0 is that an option to
generate an approximate
diagram (as per user-specified error tolerances), instead of the exact diagram,
is also provided.
5.
As the diagram is being generated, the Progress Bar (at the bottom of the screen)
shows the quantitative progress, while the Status Bar provides additional details, including the
elapsed time and the estimated time to completion. A Cancel Processing button appears just
above the status bar, and clicking this button terminates the on-going
generation process. There is also a Pause Processing|Resume Processing toggle
button that can be used to temporarily suspend and later resume the diagram
generation process at the server.
To
learn in detail about the semantics of the Picasso Diagrams, see Diagram Semantics.
Command-Line Interface
Apart from the above visual client interface, Picasso
also supports a command-line interface for generating compilation and execution
diagrams, which is especially useful for batch processing of query templates.
The details are given in Command Line Interface.
User-Specific Files
There are two user-specific files in Picasso: DBConnections
and local_conf,
both present in the PicassoRun directory. The former, which is in
binary format, is for storing the information about database connections, while
the latter, which is in text format, is for customizing the default values of
the user-settable constants. These files should be updated only through the
controls in the Picasso Client interface, as explained in Client GUI Controls.
Notes:
- If a
Picasso Client is closed, any ongoing process on the Server is not
affected. The client can be restarted later and the results of the
previous processes viewed in the normal manner.
- In case of problems, please refer the Trouble-shooting document.