Sample Picasso Diagrams » QT10  (16 Slides)     [Page 1 of 2] :: Jump To  
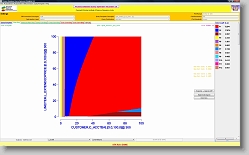
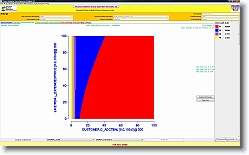
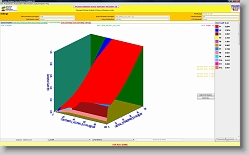
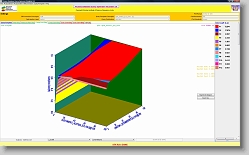
Query Template

Optimizer Diagrams
select
    c_custkey,
    c_name,
    sum(l_extendedprice * (1 - l_discount)) as revenue,
    c_acctbal,
    n_name,
    c_address,
    c_phone,
    c_comment
from
    customer,
    orders,
    lineitem,
    nation
where
    c_custkey = o_custkey
    and l_orderkey = o_orderkey
    and o_orderdate >= date '1993-10-01'
    and o_orderdate < date '1994-01-01'
    and c_nationkey = n_nationkey
    and c_acctbal :varies
    and l_extendedprice :varies
group by
    c_custkey,
    c_name,
    c_acctbal,
    c_phone,
    n_name,
    c_address,
    c_comment
order by
    revenue desc

  You have reached the first page You have reached the first page      Up one level      Next page Last page  
Plan Diagram * 1920 x 1170 * (172KB)
Reduced Diagram (20%) * 1920 x 1170 * (165KB)
Cardinality Diagram * 1920 x 1170 * (167KB)
Cost Diagram * 1920 x 1170 * (174KB)
Plan1 * 1936 x 1186 * (119KB)
  Plan Diagram  
  Reduced Diagram (20%)  
  Cardinality Diagram  
  Cost Diagram  
  Plan1  
Plan2 * 1936 x 1186 * (119KB)
Plan3 * 1936 x 1186 * (120KB)
Plan4 * 1936 x 1186 * (122KB)
Plan5 * 1936 x 1186 * (117KB)
Plan6 * 1936 x 1186 * (117KB)
  Plan2  
  Plan3  
  Plan4  
  Plan5  
  Plan6  
Plan7 * 1936 x 1186 * (119KB)
Plan8 * 1936 x 1186 * (119KB)
Plan9 * 1936 x 1186 * (119KB)
Plan10 * 1936 x 1186 * (120KB)
Plan11 * 1936 x 1186 * (119KB)
  Plan7  
  Plan8  
  Plan9  
  Plan10  
  Plan11  
Album last updated on 2/9/09 9:58 PM
Powered by Jalbum 8.1 and BluPlusPlus skin
Indian Institute of Science