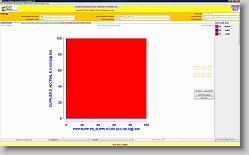
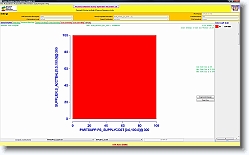
Sample Picasso Diagrams » QT11  (7 Slides)     [Page 1 of 1] :: Jump To  
Query Template

select
    ps_partkey,
    sum(ps_supplycost * ps_availqty) as value
from
    partsupp,
    supplier,
    nation
where
    ps_suppkey = s_suppkey
    and s_nationkey = n_nationkey
    and n_name = 'GERMANY'
    and ps_supplycost :varies
    and s_acctbal :varies
group by
    ps_partkey having
        sum(ps_supplycost * ps_availqty) > (
            select
                sum(ps_supplycost * ps_availqty) * 0.0001000000
            from
                partsupp,
                supplier,
                nation
            where
                ps_suppkey = s_suppkey
                and s_nationkey = n_nationkey
                and n_name = 'GERMANY'
        )
order by
    value desc

Optimizer Diagrams
  Up one level  
Plan Diagram * 1920 x 1170 * (157KB)
Reduced Diagram (20%) * 1920 x 1170 * (155KB)
Cardinality Diagram * 1920 x 1170 * (158KB)
Cost Diagram * 1920 x 1170 * (156KB)
Plan1 * 1920 x 1170 * (123KB)
  Plan Diagram  
  Reduced Diagram (20%)  
  Cardinality Diagram  
  Cost Diagram  
  Plan1  
Plan2 * 1920 x 1170 * (126KB)
Plan3 * 1920 x 1170 * (124KB)
  Plan2  
  Plan3  
Album last updated on 2/9/09 9:58 PM
Powered by Jalbum 8.1 and BluPlusPlus skin
Indian Institute of Science