Query Template
select
sum(l_extendedprice) / 7.0 as avg_yearly
from
lineitem,
part
where
p_partkey = l_partkey
and p_retailprice :varies
and l_quantity < (
select
0.2 * avg(l_quantity)
from
lineitem
where
l_partkey = p_partkey
and l_extendedprice :varies
)
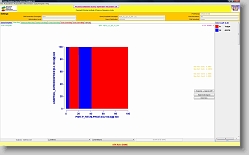
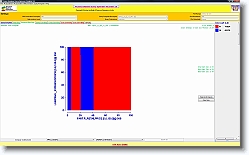
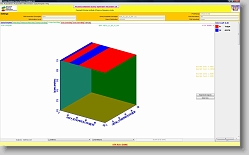
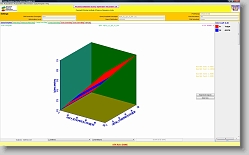
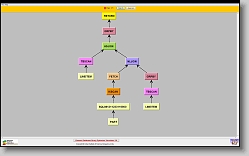
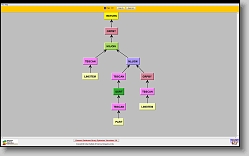
Optimizer Diagrams
|