Sample Picasso Diagrams » QT8  (66 Slides)     [Page 1 of 5] :: Jump To  
Query Template

select
    o_year,
    sum(case
        when nation = 'BRAZIL' then volume
        else 0
    end) / sum(volume)
from
    (
    select
            YEAR(o_orderdate) as o_year,
            l_extendedprice * (1 - l_discount) as volume,
            n2.n_name as nation
        from
            part, supplier, lineitem, orders, customer, nation n1, nation n2, region
        where
            p_partkey = l_partkey
            and s_suppkey = l_suppkey
            and l_orderkey = o_orderkey
            and o_custkey = c_custkey
            and c_nationkey = n1.n_nationkey
            and n1.n_regionkey = r_regionkey
            and r_name = 'AMERICA'
            and s_nationkey = n2.n_nationkey
            and o_orderdate between '1995-01-01' and '1996-12-31'
            and p_type = 'ECONOMY ANODIZED STEEL'
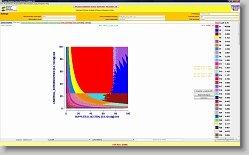
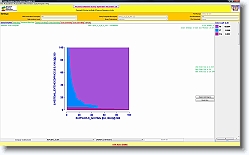
            and s_acctbal :varies
            and l_extendedprice :varies
    ) as all_nations
group by
    o_year
order by
    o_year

Optimizer Diagrams
  You have reached the first page You have reached the first page      Up one level      Next page Last page  
Plan Diagram * 1920 x 1170 * (191KB)
Reduced Diagram (20%) * 1920 x 1170 * (155KB)
Cardinality Diagram * 1920 x 1170 * (193KB)
Cost Diagram * 1920 x 1170 * (185KB)
Plan1 * 1936 x 1186 * (103KB)
  Plan Diagram  
  Reduced Diagram (20%)  
  Cardinality Diagram  
  Cost Diagram  
  Plan1  
Plan2 * 1936 x 1186 * (103KB)
Plan3 * 1936 x 1186 * (112KB)
Plan4 * 1936 x 1186 * (109KB)
Plan5 * 1936 x 1186 * (102KB)
Plan6 * 1936 x 1186 * (108KB)
  Plan2  
  Plan3  
  Plan4  
  Plan5  
  Plan6  
Plan7 * 1936 x 1186 * (113KB)
Plan8 * 1936 x 1186 * (111KB)
Plan9 * 1936 x 1186 * (112KB)
Plan10 * 1936 x 1186 * (103KB)
Plan11 * 1920 x 1200 * (110KB)
  Plan7  
  Plan8  
  Plan9  
  Plan10  
  Plan11  
Album last updated on 2/9/09 9:57 PM
Powered by Jalbum 8.1 and BluPlusPlus skin
Indian Institute of Science