Query Template
select
n_name,
o_year,
sum(amount)
from
(
select
n_name,
YEAR(o_orderdate) as o_year,
l_extendedprice * (1 - l_discount) - ps_supplycost * l_quantity as amount
from
part, supplier, lineitem, partsupp, orders, nation
where
s_suppkey = l_suppkey
and ps_suppkey = l_suppkey
and ps_partkey = l_partkey
and p_partkey = l_partkey
and o_orderkey = l_orderkey
and s_nationkey = n_nationkey
and p_name like '%green%'
and s_acctbal :varies
and ps_supplycost :varies
) as profit
group by
n_name, o_year
order by
n_name, o_year desc
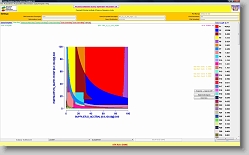
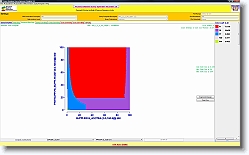
Optimizer Diagrams
|