Query Template
select
c_name,
c_custkey,
o_orderkey,
o_orderdate,
o_totalprice,
sum(l_quantity)
from
customer,
orders,
lineitem
where
o_orderkey in (
select
l_orderkey
from
lineitem
where l_extendedprice :varies
group by
l_orderkey having
sum(l_quantity) > 300
)
and c_custkey = o_custkey
and o_orderkey = l_orderkey
and c_acctbal :varies
group by
c_name,
c_custkey,
o_orderkey,
o_orderdate,
o_totalprice
order by
o_totalprice desc,
o_orderdate
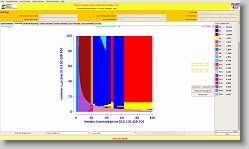
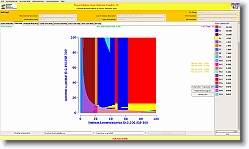
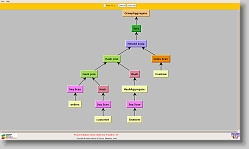
Optimizer Diagrams
|