Query Template
select
s_acctbal,
s_name,
n_name,
p_partkey,
p_mfgr,
s_address,
s_phone,
s_comment
from
part,
supplier,
partsupp,
nation,
region
where
p_partkey = ps_partkey
and s_suppkey = ps_suppkey
and p_retailprice :varies
and s_nationkey = n_nationkey
and n_regionkey = r_regionkey
and r_name = 'EUROPE'
and ps_supplycost <= (
select
min(ps_supplycost)
from
partsupp,
supplier,
nation,
region
where
p_partkey = ps_partkey
and s_suppkey = ps_suppkey
and s_nationkey = n_nationkey
and n_regionkey = r_regionkey
and r_name = 'EUROPE'
and ps_supplycost :varies
)
order by
s_acctbal desc,
n_name,
s_name,
p_partkey
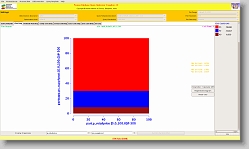
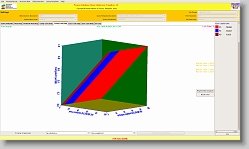
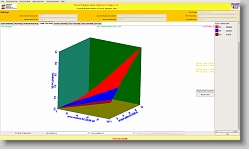
Optimizer Diagrams
|