Query Template
select
l_orderkey,
sum(l_extendedprice * (1 - l_discount)) as revenue,
o_orderdate,
o_shippriority
from
customer,
orders,
lineitem
where
c_mktsegment = 'BUILDING'
and c_custkey = o_custkey
and l_orderkey = o_orderkey
and o_totalprice :varies
and l_extendedprice :varies
group by
l_orderkey,
o_orderdate,
o_shippriority
order by
revenue desc,
o_orderdate
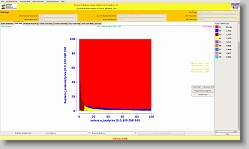
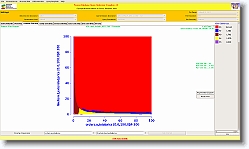
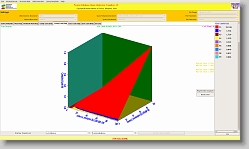
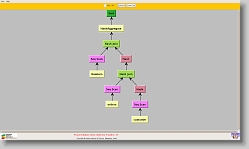
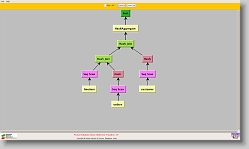
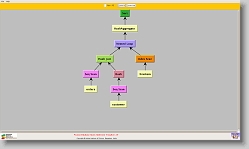
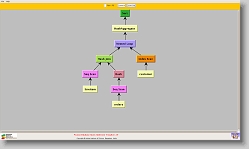
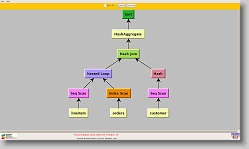
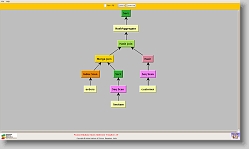
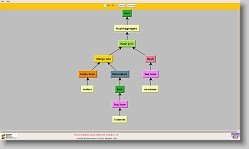
Optimizer Diagrams
|