Query Template
select
supp_nation,
cust_nation,
l_year,
sum(volume) as revenue
from
(
select
n1.n_name as supp_nation,
n2.n_name as cust_nation,
DATE_PART('YEAR',l_shipdate) as l_year,
l_extendedprice * (1 - l_discount) as volume
from
supplier,
lineitem,
orders,
customer,
nation n1,
nation n2
where
s_suppkey = l_suppkey
and o_orderkey = l_orderkey
and c_custkey = o_custkey
and s_nationkey = n1.n_nationkey
and c_nationkey = n2.n_nationkey
and (
(n1.n_name = 'FRANCE' and n2.n_name = 'GERMANY')
or (n1.n_name = 'GERMANY' and n2.n_name = 'FRANCE')
)
and l_shipdate between '1995-01-01' and '1996-12-31'
and o_totalprice :varies
and c_acctbal :varies
) as shipping
group by
supp_nation,
cust_nation,
l_year
order by
supp_nation,
cust_nation,
l_year
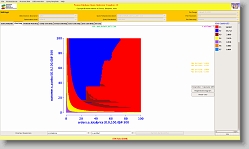
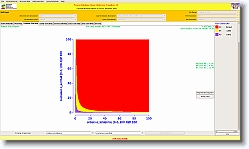
Optimizer Diagrams
|